 Hable con un agente al (888) 572-7520
 Enviar mensaje a un agente


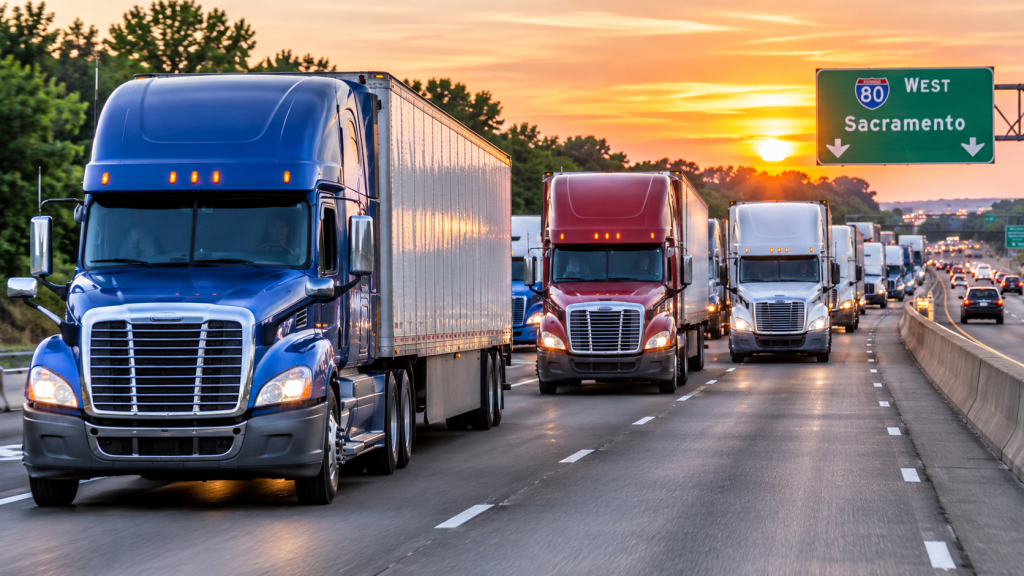

The American Transportation Research Institute (ATRI) published its report, “The Cost of Congestion to the Trucking Industry: 2026 Update,” in which it assessed traffic congestion on U.S. highways using various data sources. The findings revealed that congestion generated an additional $128.2 billion in costs for the trucking industry in 2024, an increase of $4.7 billion compared to 2022.
The 2024 figure marks the third consecutive year in which annual congestion costs exceeded $120 billion. In 2023, costs reached a record high of $129.8 billion, driven by the prolonged freight recession, which reduced truck miles traveled. Before the COVID-19 pandemic in 2020, annual congestion costs peaked at $99.5 billion.
Jeremy Carmichael, Vice President of Operations at Ruan Transportation Management Systems, stated in a recent article published by the American Journal of Transportation that rising costs can be addressed through targeted infrastructure investments in the country’s most congested freight corridors, along with a commitment at all levels of government to modernize highways and improve supply chain efficiency.
The Cost of Congestion to the Trucking Industry
For its report, ATRI used its extensive truck GPS database and the latest figures from its An Analysis of the Operational Costs of Trucking report to calculate the impact of highway delays on trucking operations across the United States. The metrics included an updated methodology for calculating hourly truck operating costs, which increased the reported figures for all previous years.
The congestion cost calculation is based on three key inputs:
- Average speed: Average combined truck speeds on the country’s major congestion corridors are used to identify delay time, calculated as the difference between average highway speeds and free-flow speeds (55 MPH).
- Truck volume/Vehicle Miles Traveled (VMT): Combined truck traffic mileage for each geographic area and road type measures the volume of trucks affected by delays.
- Operating costs: The marginal hourly operating costs of a Class 7/8 combination truck, when multiplied by the hours of delay and the volume of affected trucks, determine the total congestion cost for the location in question.
According to ATRI, highway congestion worsened in both 2023 and 2024, based on average truck speed measurements. However, trucking operating costs remained stable, while truck miles traveled declined in 2024. This resulted in slower traffic speeds, which drove trucking congestion costs to a new record in 2023. These costs were subsequently offset by a decline in the industry’s total mileage in 2024, amid a prolonged freight recession.
Additionally, ATRI highlighted that the 1.24 billion hours of cumulative congestion-related delays in 2024 were equivalent to 451,615 truck drivers being idle for an entire working year. When distributed across the population of registered trucks, congestion costs averaged $7,973 per truck in 2024.

States with the Highest Congestion Costs in 2024
In addition to its nationwide findings, ATRI’s analysis documented delays across states and metropolitan areas, as well as their corresponding cost impacts. Three of the top ten states recorded congestion costs exceeding $10 billion, led by Texas, California, and Florida. Combined, the top ten states accounted for more than half (53%) of nationwide trucking congestion costs.
The 10 states with the highest congestion costs in 2024 were:
- Texas – $10,923,824,165
- California – $10,469,672,315
- Florida – $10,351,677,835
- New York – $7,122,889,688
- Illinois – $5,205,351,623
- New Jersey – $5,177,934,043
- Tennessee – $4,970,906,225
- Georgia – $4,770,862,006
- Pennsylvania – $4,644,203,884
- North Carolina – $4,367,755,387
The top three states helped shape the national trend, with congestion costs increasing in 2023 before declining in 2024. The remaining states, with the exception of Georgia, recorded consecutive annual increases in congestion costs, ATRI explained in its official report.
Tennessee climbed three positions compared to the 2022 figures, while North Carolina reentered the top ten in 2024 for the first time since 2020. Illinois moved up two positions despite recording moderate growth rates. Georgia dropped three positions, as the only state among the top ten to experience two consecutive years of declining congestion costs, while Pennsylvania fell one position.
Traffic congestion not only caused lost hours but also resulted in the waste of 6.66 billion gallons of diesel, with a total impact on emissions of 67.8 million metric tons of CO2.
ATRI concludes that persistent traffic congestion remains one of the main factors influencing these trucking costs year after year; however, investment in infrastructure can make a difference.
 Business hours: Monday to Friday from 8:00 AM to 5:00 PM. California time