 Hable con un agente al (888) 572-7520
  Enviar mensaje a un agente



The culmination of the 2026 World Cup, which crowned Spain as the new champion, left an unprecedented macroeconomic impact on U.S. logistics infrastructure, transforming heavy freight routes into a multi-billion dollar engine. According to consolidated official data from global consulting firms such as Oxford Economics and specialized organizations, the direct injection into the U.S. Gross Domestic Product (GDP) reached the astronomical figure of $17.2 billion.
For trucking companies, the FIFA World Cup ceased to be a mere sporting event, becoming a massive capacity challenge. The national supply chain absorbed record demand due to the 104 matches played in three countries under the trade agreement between the United States, Mexico, and Canada (USMCA).
At the logistical level, the movement of heavy cross-border cargo accelerated commercial operations during June and July. This increase generated a constant flow at land ports of entry and on the country’s main interstate networks.
Surge in Refrigerated Cargo and Rates
The supply chain for food, beverages, and promotional merchandise associated with the 2026 World Cup generated extreme pressure on truck availability. Technical reports from logistics firms like Kenco Group confirmed a 10.5% increase in demand for refrigerated trucks (reefers) on the highways connecting to the 11 host cities in the United States. This far exceeded the average growth of 8% recorded in the rest of the country.
This spike in direct consumption at stadiums and fan zones pushed freight rates to unprecedented levels. The general freight market in key markets along the Northeast corridor, particularly the axis connecting Philadelphia and New York, averaged peak spot rates of up to $6.50 per mile for last-mile deliveries with restricted time windows.
Truckload transportation during the 2026 World Cup absorbed critical restocking in response to emergency shortages at convenience stores and supermarkets. The massive influx of trade required the internal mobilization of millions of tons of supplies, pushing the traditional logistics sector to its limit during the summer.
The following details the estimated macroeconomic and fiscal impact on the nation:
| World Cup Economic Indicator | Consolidated Figure (USD) | Official Source |
|---|---|---|
| Direct Contribution to U.S. GDP | $17.2 billion | Oxford Economics / FIFA |
| Net Tourist Spending | $6.4 billion | Tourism Economics |
| Total Event Operations Spending | $11.1 billion | FIFA-WTO Study |
| Government Tax Revenue Collected | $3.4 billion | FIFA-WTO Socioeconomic Analysis |
Border Logistics and Last-Mile Bottlenecks
The weight of USMCA regulations became critically important for trucking operators due to the trinational nature of the tournament. According to a corporate report by Gebrüder Weiss, the supply of the Mexican and Canadian venues depended on US ground transportation, forcing fleets to operate inventory rotation cycles in significantly shorter timeframes.
Land ports of entry in Texas and along the northern border experienced surges in the inspection of commercial cargo and multimedia broadcasting equipment. This substantially increased customs wait times and necessitated the intensive use of real-time cargo visibility technologies to avoid logistical penalties.
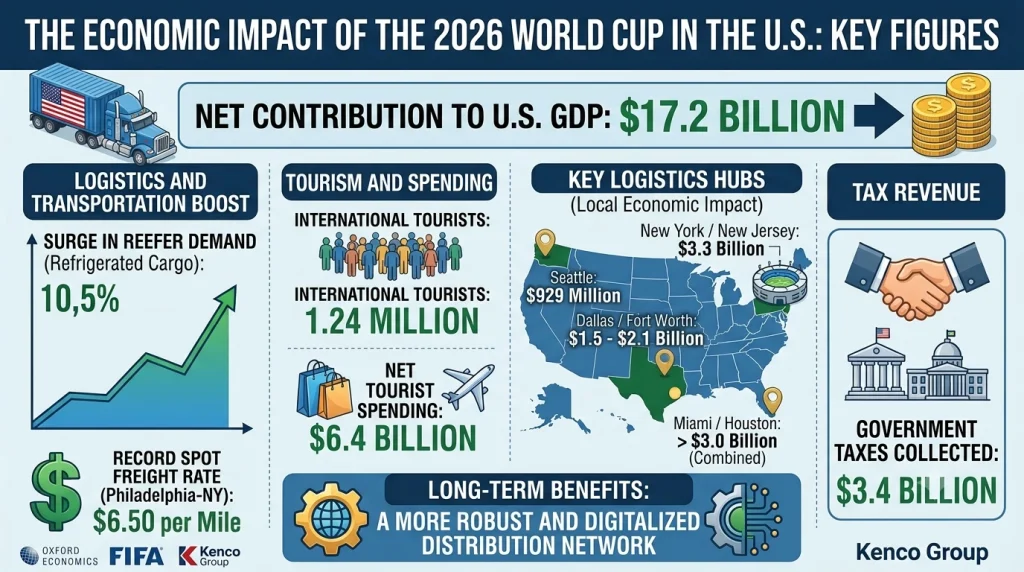
On the other hand, the arrival of 1.24 million international travelers for the 2026 World Cup required drastic traffic plans in major metropolitan areas. Cities like New York implemented temporary road closures and direct restrictions on heavy transport in financial districts and around stadiums, forcing a reconfiguration of nighttime delivery routes.
The geographic impact of spending and movement was not uniform across the country, concentrating sharply in key logistics hubs:
- New York/New Jersey: Led the overall macroeconomic impact with $3.3 billion injected into its local economy thanks to hosting eight matches, including the final at MetLife Stadium.
- Dallas/Fort Worth: Registered a projected impact of between $1.5 billion and $2.1 billion with the extensive use of AT&T Stadium.
- Seattle: Reported net transportation and tourism revenue of $929 million, with direct local transportation spending of $652.6 million.
- Miami and Houston: Recorded a combined impact exceeding $3 billion, driven by their port drayage and intermodal capabilities.
For the U.S. trucking industry, the final statistics confirm that the economic benefits will be sustained long-term. The accelerated modernization and digitization of logistics corridors to meet the standards required for the 2026 World Cup has resulted in a much more robust and connected domestic distribution network to face the transportation challenges of the near future.
 Business hours: Monday to Friday from 8:00 AM to 5:00 PM. California time