 Hable con un agente al (888) 572-7520
  Enviar mensaje a un agente

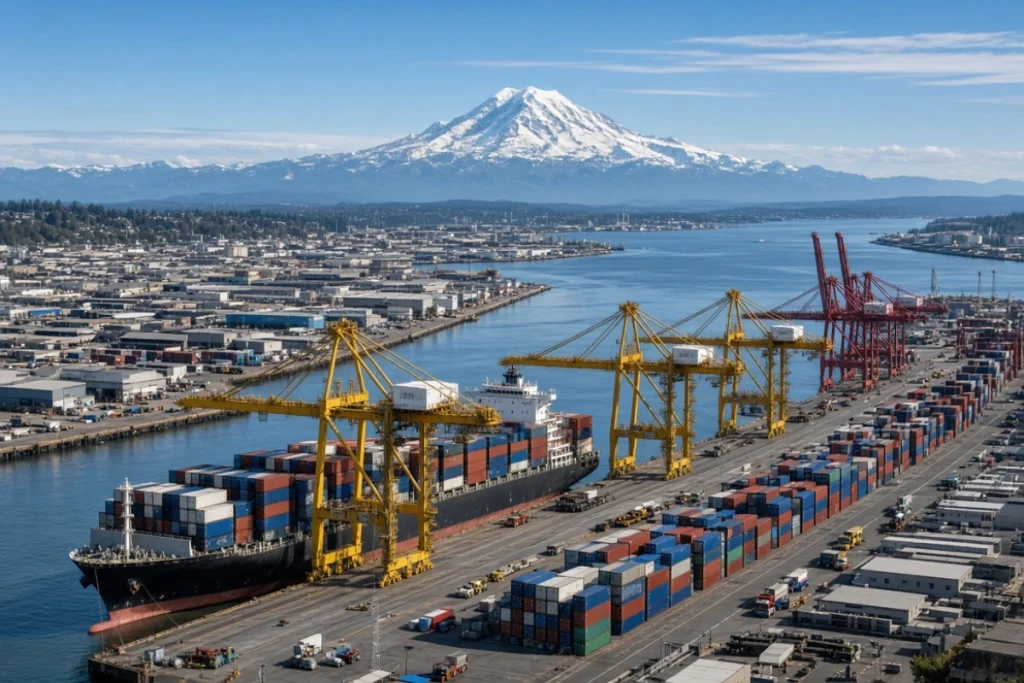

Furniture, auto parts, machinery, and electronics lead imports through the ports of Seattle and Tacoma, according to official data from the Northwest Seaport Alliance.
In 2025, the NWSA handled 3.2 million containers (TEUs) and more than 22.5 million metric tons of cargo, with China, Japan, Vietnam, South Korea, and Taiwan as the five main origins of those goods. Overall, the Seattle region’s maritime trade reached $70.3 billion in imports during 2025.
Washington’s ports—Seattle and Tacoma, jointly operated by the Northwest Seaport Alliance (NWSA)—primarily receive furniture, machinery, auto parts, plastics, toys, textiles, small appliances, and clothing.
How Washington’s Ports of Entry Operate
The Seattle–Tacoma port complex consists of two ports that do not compete with each other. Since 2015, they have operated jointly under the Northwest Seaport Alliance (NWSA), a partnership that manages container terminals, breakbulk cargo, automobiles, and some bulk cargo facilities in both cities.
It is one of North America’s main gateways for containerized cargo and one of the most important entry points to the Asian market, thanks to its geographic proximity to Asia compared with other West Coast ports.
According to official NWSA data, maritime cargo activity supports more than 52,000 jobs and generates $14 billion in economic output for Washington, one of the states most dependent on foreign trade in the country.
What Goods Enter Through Washington’s Ports?
According to the NWSA’s 2025 annual trade report, also released by the Port of Seattle, the main import categories by merchandise value are:
- Furniture.
- Industrial machinery.
- Auto parts, or motor vehicle parts.
- Plastics.
- Toys.
- Small appliances.
- Clothing and textiles.
There is also a broad category of “other imports,” which includes a variety of consumer products. According to logistics industry reports, industrial machinery, computers, electronic components, and auto parts also enter the region on a regular basis, consistent with the profile of a port focused on supplying consumer goods and industrial inputs to the U.S. interior.
One important fact helps illustrate the scale of these operations: the NWSA can receive ships with a capacity of more than 24,000 TEUs, making them some of the largest container vessels currently operating in the world. This confirms Washington’s role as a large-scale entry point to the U.S. market.
Where the Goods Come From: Main Trading Partners
According to the NWSA’s official ranking by container volume (TEUs) in 2025, the ten leading import origins are:
- China.
- Japan.
- Vietnam.
- South Korea.
- Taiwan.
- Thailand.
- Indonesia.
- Malaysia.
- India.
- The Philippines.
When the ranking is organized by the value of the goods transported, the order changes slightly: Japan moves into first place, followed by China, South Korea, Vietnam, and Taiwan.
India deserves a separate mention. It is the ninth-largest trading partner by volume, and according to weekly reports from the NWSA, its main exports to Washington include textiles, stone, gypsum and cement, various types of machinery, seafood, and furniture.
It Is Not All Imports: What Washington Exports Through Its Ports
Although this article focuses on incoming goods, it is useful to consider the other side of the trade balance to understand the state’s overall commercial role. According to the same NWSA report, the main export products shipped through Washington’s ports are hay and forage, frozen potatoes, recovered paper, soybeans, and paper and cardboard.
At the regional level, Greater Seattle exported $47.5 billion worth of goods during 2025, led by aircraft and aerospace components, electrical machinery, and electronic equipment.
Washington is also a significant agricultural player in international trade. It is the leading apple-producing state in the United States and the country’s third-largest producer of lentils. These products are shipped through the same ports to markets such as India.
Recent Context: Volumes and Tariffs
Trade through Washington’s ports is not static. According to data released by the NWSA and reported by specialized port-logistics media, the total container volume handled in 2025 was 3.2 million TEUs, a 5.5% decline from 2024. The decrease was partly attributed to imports being moved forward ahead of potential new tariffs, as well as negotiations over port and rail labor contracts in Canada.
In 2026, the trend remained mixed. During the first half of the year, total container volume fell 12.4% year over year, with full import loads down 13.9%, while exports remained above the five-year average.
Industry analysts attribute part of this decline to cargo being diverted to the ports of Los Angeles and Long Beach. These ports grew strongly during the second quarter of 2026 while the NWSA declined, widening the gap between the two port regions.
Frequently Asked Questions
What are the main products entering through Washington’s ports?
Furniture, industrial machinery, auto parts, plastics, toys, small appliances, and clothing are the most significant import categories by value, according to the Northwest Seaport Alliance’s annual report.
Which country is the main source of imports arriving in Washington?
China is the leading trading partner by container volume. By merchandise value, Japan ranks first.
How many containers do Washington’s ports handle each year?
The Northwest Seaport Alliance handled 3.2 million TEUs—twenty-foot equivalent units—during 2025.
What is the difference between the Port of Seattle and the Port of Tacoma?
They are separate administrative entities, but since 2015 they have operated their maritime cargo activities jointly under the Northwest Seaport Alliance. The NWSA manages the container terminals, breakbulk cargo, automobile facilities, and bulk cargo operations of both ports.
 Business hours: Monday to Friday from 8:00 AM to 5:00 PM. California time