
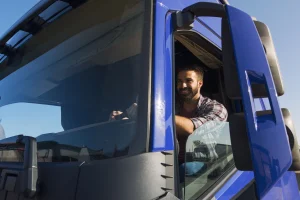
What Truck Drivers Love Most About Their Job
Truck driving isn’t just a job; for many, it’s a calling that offers a unique blend of freedom, adventure, and independence. By Bob Dilliplaine, Industry
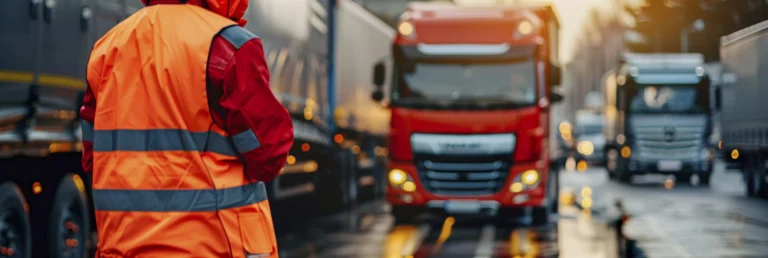
Frozen Roads After Bomb Cyclone: Black Ice, Record Snow and High Risk for Trucks
Frozen roads continue to disrupt freight transportation following the impact of a powerful bomb cyclone, leaving behind black ice, highway shutdowns, power outages, and dangerous winter driving conditions stretching from the Gulf Coast to New England.

Lunar New Year 2026: Ancient Traditions, Renewed Energy, and Massive Celebrations
Lunar New Year 2026 begins on February 17 under the sign of the Fire Horse and is marked by spiritual rituals, family reunions, and large-scale celebrations in both China and the United States, especially in California.

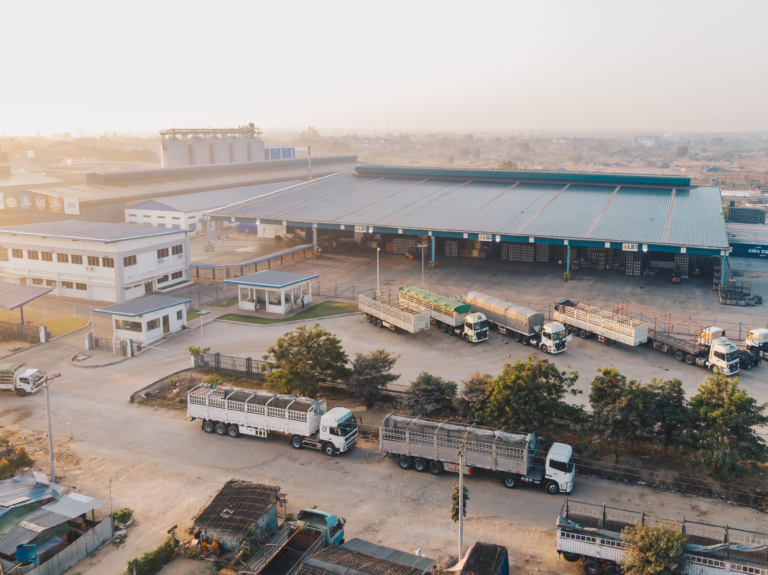
Freedom 250 Grand Prix: How Logistics and Transportation Will Power the Race in Washington
The first-ever IndyCar street race in Washington, D.C., scheduled for August 21–23, will headline the United States’ 250th anniversary celebrations — and it will trigger a massive transportation, freight, and urban logistics operation behind the scenes.

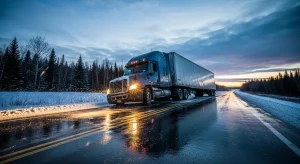
Groundhog Day: What It Means for Trucking When “Phil Sees His Shadow”
The forecast from America’s most famous groundhog is calling for more winter — and that’s an important signal for the trucking industry and cold-season route planning

Love on the open road: the best dating apps for truckers
If you’re looking for someone to go the long haul with, here are the best dating apps for truck drivers. They say love is everywhere…