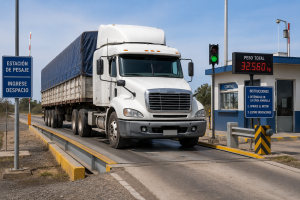
Llame al (888) 572-7520 para hablar con un agente

Drivers in the U.S. spent an average of 43 hours stuck in traffic in 2024, amounting to an impressive $771 per person in lost time and productivity.

The transportation data and analytics company INRIX, Inc. recently published its study titled “2024 Global Traffic Scorecard,revealing that U.S. citizens lose the equivalent of a full week each year stuck in traffic congestion.

The report examines congestion trends in nearly 1,000 cities across 37 countries. New York and Chicago are among the most affected cities globally. According to Bob Pishue, a transportation analyst at INRIX, traffic has seen a significant increase since 2020, with a notable surge in technology-heavy areas like San Jose, San Francisco, and Seattle.

Meanwhile, the American Transportation Research Institute (ATRI) reported in December in its “Cost of Congestion” report that highway traffic jams resulted in a record $108.8 billion in costs in 2022. This figure represents the time lost by truck drivers, as well as an additional $32.1 billion spent on fuel. “Every minute lost in traffic translates into wasted money and productivity, added Pishue.

En la imagen se muestra una congestión de tráfico

The 10 most congested routes in the U.S.

Drivers in the U.S. spent an average of 43 hours stuck in traffic in 2024, amounting to an impressive $771 per person in lost time and productivity. However, three cities stand out particularly on the congestion lists: New York, Chicago, and Los Angeles. In these cities, drivers lost an average of 102 hours per year due to traffic in New York and Chicago, and 88 hours in Los Angeles.

Chicago has 6 of the most congested routes in the U.S., while New York has 2. Here’s the list of the 10 most congested routes in the country:

  1. Stamford, CT I-95 SB between Westport and Indian Field Road
  2. Boston, MA I-93 SB between Charles River and Pilgrim’s Highway
  3. Dallas, TX US-80 EB between I-635 and Forney, TX
  4. New York, NY I-278 BQE WB between I-495 I’Chnge and Tillary Street
  5. Chicago, IL I-55 SB between I-90 and S Cicero Ave
  6. Chicago, IL I-90 EB between Cicero Ave and W Fullerton Ave
  7. Chicago, IL I-90 EB between Cicero Ave and Ohio Street
  8. New York, NY Cross Bronx Expy SB between Bruckner Expy and Walter Gladwin Park
  9. Chicago, IL I-290 EB between S Wolf Road and Harlem Ave
  10.  Chicago, IL I-90 WB between W Ontario Street and W Irving Park Rd
 

Overall increase in congestion

Another important traffic index is that U.S. cities experienced a 9% overall increase in congestion compared to the previous year. New York, San Francisco, and Honolulu stand out among cities with the lowest speeds. In New York, a 6-mile trip through the city can take up to 30 minutes, with an average speed of only 12 mph.

The report also points out that the increase in traffic is largely due to economic growth, outdated infrastructure, and the rise in e-commerce, which has boosted freight traffic.

In light of this, the cost of congestion and quality of life remain concerns. Without stricter regulations and more investment in sustainable transportation, traffic may continue to worsen, affecting millions of citizens.

Facebook
Twitter
LinkedIn
WhatsApp

Leave a Reply

Your email address will not be published. Required fields are marked *

Business hours: Monday to Friday from 8:00 AM to 5:00 PM. California time
Leave your number and a member of our company will contact you
Horario de atención: Lunes a viernes de 8.00 AM a 5.00 PM. Hora california

Deje su número y un miembro de nuestra empresa se pondrá en contacto con usted