


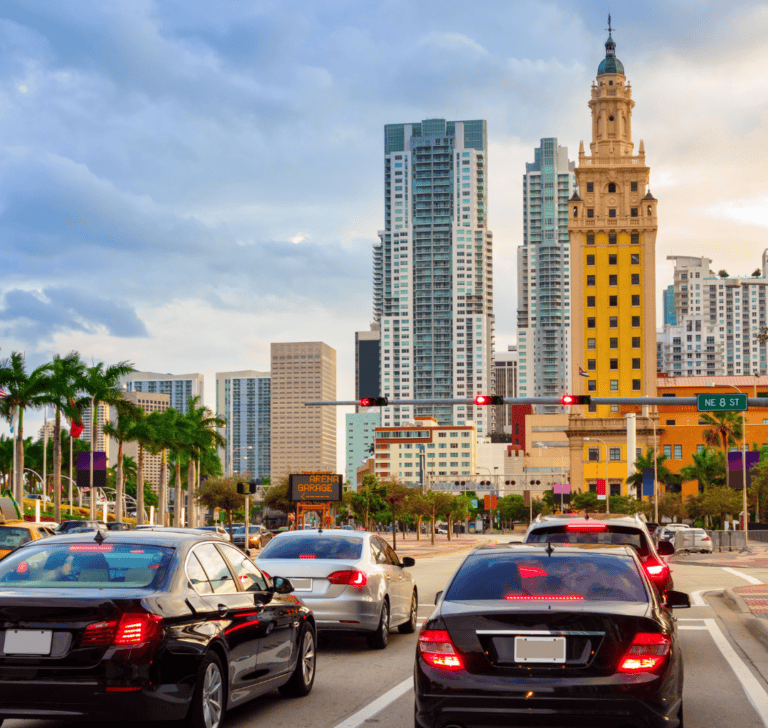
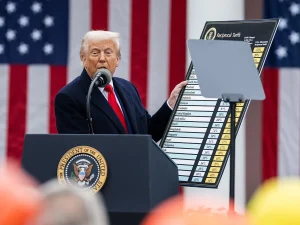
More Tariffs? New U.S. Trade Measures Target 60 Countries
President Donald Trump is set to launch a new round of double-digit tariffs on imports from 60 countries.

New Bill Would Make Staged Commercial Truck Accidents a Federal Crime
Florida Senator Ashley Moody pushes federal crackdown on staged truck accidents.
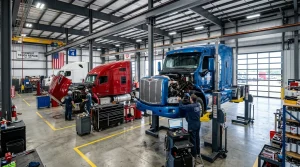
How Much Does It Cost to Maintain a Truck Each Year?
How much does it really cost to run a commercial truck? Fuel, tires, maintenance, insurance, and repairs make a commercial truck one of the most expensive tools.
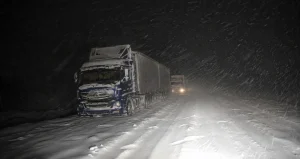
Snowbound: Truckers Stranded on One of the World’s Toughest Roads
More than 600 truck drivers are waiting in the Andes for the reopening of the corridor linking the Atlantic and Pacific oceans—one of the most challenging mountain routes on Earth.

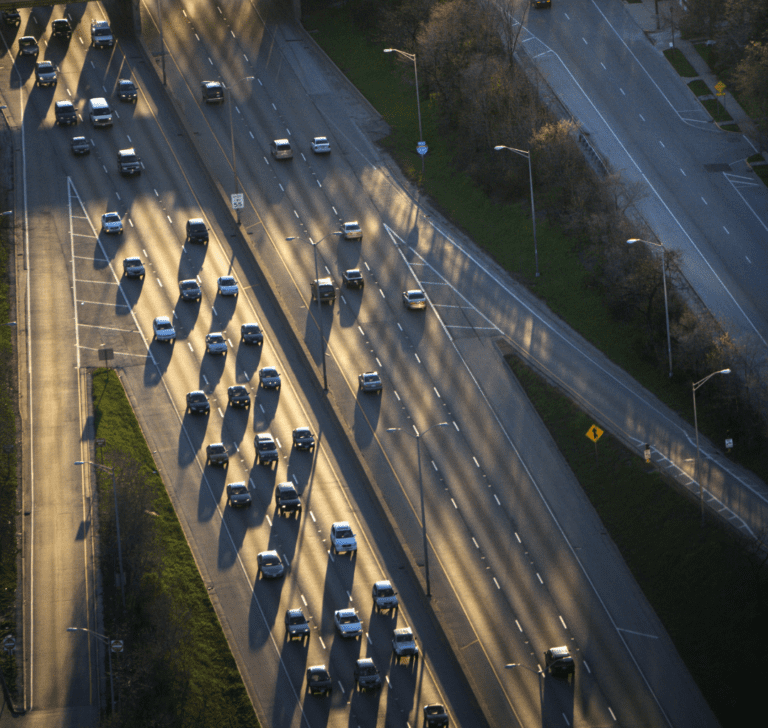
From those beloved historic routes to the power of the new interstate highways
The harshness of the old Route 66 gave way to the efficiency of today’s superhighways. With greater efficiency, technology, and services, the asphalt and the transportation business in the U.S. were transformed.
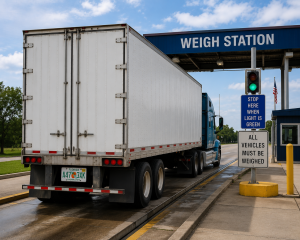
Florida Truck Weight Limits: What You Need to Know
In Florida, truck weight limits include some exceptions, but it is essential to comply with state regulations to avoid penalties.